TrevoScrub-MMAF-C19-VCV
A. Overview
Part of the TrevoScrub series – Control (disambiguation)
Day 121 – As of today, we have 4 months of data! So, let’s audify (or, perhaps, sonify) within VCV Rack!
TrevoScrub-MMAF-C19-VCV is a data collection with example VCV Racks that operate as a sicklical (™ TrevoLabs) stereo, multimode filter setup, based on realtime Corona-19 data. With 4 months of data, we leverage some nice curves. I’m starting with multimode auto-filter manipulation since it’s the most obvious to hear. The data could be applied to pitch sets and other compositional dimensions.
Data is provided by geographic location as individual areas (e.g. Germany and San Diego) and as grouped data sets (e.g. specific cities or specific countries).
B. Quick Start
- Download – TrevoScrub-MMAF-C19-Data.zip (see below)
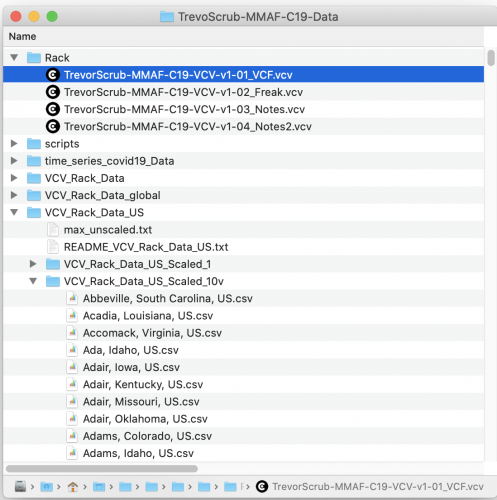
- Uncompress – to create the “TrevoScrub-MMAF-C19-Data” folder
- Launch VCV Rack and Open a Rack– In the Rack folder, such as: TrevorScrub-MMAF-C19-VCV-v1-01_VCF.vcv
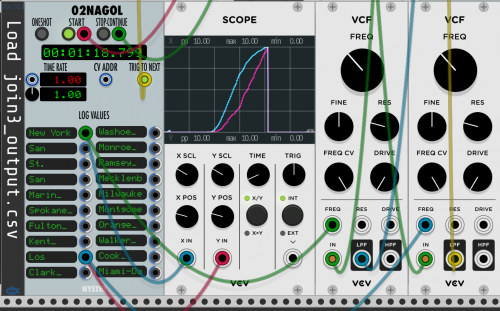
- Right click on 02NAGOL – browse to find a CSV. For example “join3_output.csv” in the VCV_Rack_Data is the data file for 20 Specific Cities of Interest scaled 0 – 10v
- Go – Unmute the 4MIX, click the “ON” (top TRIGGER) and click “RUN” on CLOCKED.
- Experiment – with the Oscillator Type and frequency, Time Scale, Hold time, Factors, Filter type and Q. Try changing patch cables to select different geographic locations.
C. History and Research
The data set was was originally built into a Max for Live patch and connected with an X-Touch controller with Ableton automation capture. After sharing the X-Touch features with the VCV Rack FB group, the folks there pointed me to the LOGAN20 and 02NAGOL modules by NYSTHI for data record and recall. And, these are amazing!
I am sharing reformatted versions of the “time_series_covid19” data. My CSV files can be loaded straight into the 02NAGOL module. In short, I’ve taken the two data files for “confirmed” US and Global data sets and parsed them into over 14,000 individual CSV files. So, for example, you can load up confirmed cases from “San Diego, California” with a 0-10v scale, or you can load up Germany scaled to the US. I have also computed “new cases”. These are all scaled in various ways to make it possible to audify with 02NAGOL.
I’d like to thank the “VCV Rack Official User Group” for the discussion that led to the use of 02NAGOL, NYSTHI for creating the module and the Johns Hopkins University Center for Systems Science and Engineering (JHU CSSE) for sourcing the data. I’d also like to thank Jeff Kaiser and our “Made Audible” project for inspiring me to audify data in various ways.
The TrevoScrub-MMAF-C19 Max for Live plugin evolved out of research performed in collaboration with Jeff Kaiser at STEIM. I found the data sets through links on the 91-divoc.com site. After some discussion on the VCV Rack Official User Group, it became clear that VCV Rack was a more interesting tool for audifying this sort of data. Users Omer, Artem, Frequence Morte, Gabriel and Antonio all gave valuable feedback. They pointed out these options for controlling VCV Rack:
- Stoermelder MIDI-CAT module for remapping note data
- Stoermelder ReMOVE Lite module for automating knobs and faders
- NYSTHI MusicalBox2 module for recording 16 channels of CV
- NYSTHI LOGAN20 and 02NAGOL modules for recording and saving data as CSV
D. Example Racks for Audification
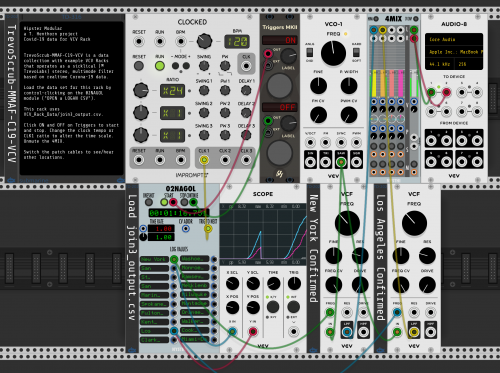
There are 5 example Racks with the V1.0 Zip. They are progressively more complex. In each, Load the data set for the rack by control-clicking on the 02NAGOL module (“OPEN a LOGAN CSV”). Click ON and OFF on Triggers to start and stop the scrubbing of the data. Change the clock tempo or CLK1 ratio to alter the time scale. Unmute the 4MIX. Click “RUN” on the CLOCKED to start stop the scrubbing.
Switch the patch cables to see/hear other locations. Note that there are cables for the scope and for the audification.
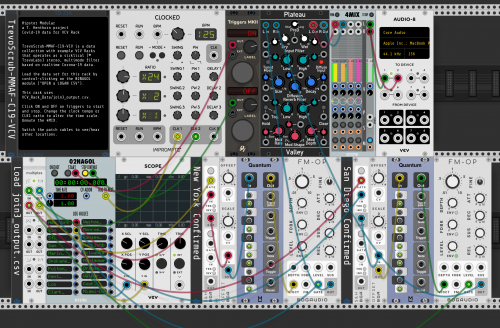
- TrevorScrub-MMAF-C19-VCV-v1-01_VCF.vcv – A two-city example illustrating a sawtooth wave through two VCF modules, panned left and right. Load the “join3_output.csv” data file. With that, the Rack will scrub through New York and Los Angeles.
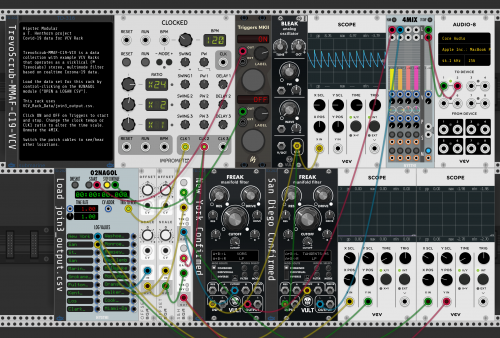
- TrevorScrub-MMAF-C19-VCV-v1-02_Freak.vcv – this Rack uses Vult modules and adds sample-and-hold and offset modules. It also uses join3_output.csv, but is patched for New York and San Diego. The filter changes are clocked via CLK2.
- TrevorScrub-MMAF-C19-VCV-v1-03_Notes.vcv – This Rack also uses join3_output.csv and compares New York and San Diego. FM-OP instruments are used instead of filters. The data is sampled, scaled and then quantized to notes within a scale. Reverb is added.
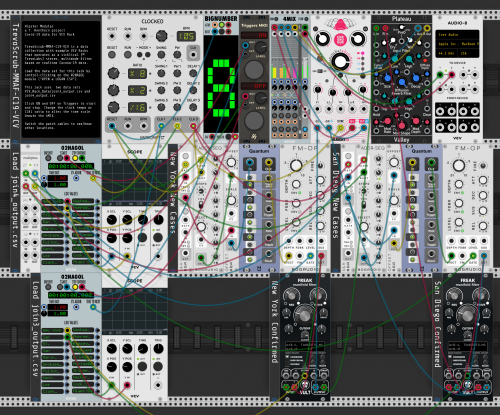
- TrevorScrub-MMAF-C19-VCV-v1-04_Notes_Cities.vcv – This Rack uses also compares New York and San Diego, but does it in two dimensions. It uses join4_output.csv (New Cases) to trigger notes (as in example 3) and then uses join3_output.csv to sweep the filter. Each city also has a sequencer (clocked from CLK3) to adjust the scale (to a type of chord progression). A Big counter shows progression steps. Echo and reverb are added.
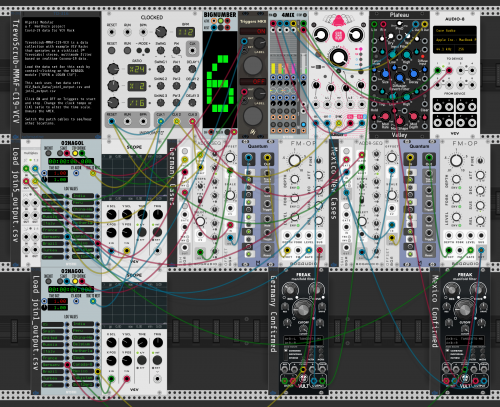
- TrevorScrub-MMAF-C19-VCV-v1-05_Notes_Countries.vcv – This Rack is almost identical to #4. It uses join5_output.csv and join1_output.csv to compare Germany and Mexico. The tempo and scrubbing resolution (CLOCKED) are different from #4 and the chord sequence is 4 steps.
Ex. 1
Ex. 2
Ex. 3
Ex. 4
Ex. 5
E. Development Status
Version 1.0 released. This includes 8 Data sets – for each US and GLOBAL:
- Scaled_1 (not scaled; good for troubleshooting, but the numbers are generally too high for 02NAGOL)
- Scaled_10v (each file is scaled from 0 to 10v)
- Scaled_Max (the files are scaled to the max in the set; for example, the Global is scaled to US)
- Diff_10v (the daily difference or “new cases” scaled 0 to 10v)
I have been experimenting with population data. Normalizing by population turns out to be tricky since the data sets do not correlate. Also, In my limited tests, adding population doesn’t actually audify in interesting ways. So, I’m not including population with V1.0.
I did create a “joined” dataset which groups up to 20 data sets for use in a single 02NAGOL module. I am including one example join for US and one for Global. I’m not including the join scripts with V1.0.
F. Files and Folders
The TrevoScrub-MMAF-C19-Data folder contains data files for use with the 02NAGOL module in VCV Rack. TrevoScrub-MMAF-C19-Data contains the following:
- VCV_Rack_Data/ – Folder with support data. The joined CSV files are also saved here.
- VCV_Rack_Data_US/ – data sets based on US “confirmed” data scaled in 4 ways:
– Scaled_1/
– Scaled_10v/
– Scaled_Max/
– Diff_10v/
join1.txt (one example join file)
max_unscaled.txt (the peak in each file; good for troubleshooting) - VCV_Rack_Data_global/ – data sets based on global “confirmed” data scaled in 4 ways (same as above).
- time_series_covid19_Data/ – source data from JHU CSSE, updated 5/22/2020
3262 time_series_covid19_confirmed_US.csv
267 time_series_covid19_confirmed_global.csv
3262 time_series_covid19_deaths_US.cs
267 time_series_covid19_deaths_global.cs
253 time_series_covid19_recovered_global.csv
G. Joined Data Sets
I created some joined data sets. This makes it possible to use 1 instance of the 02NAGOL module for 20 different locations. I’m not sharing the script yet, but these joined data sets are available now (in the VCV_Rack_Data folder):
- join1_output.csv – Compare Some Countries each scaled 0 – 10v
- join2_output.csv – Compare just US, Sweden and Brazil
- join3_output.csv – Compare Specific Cities of Interest scaled 0 – 10v
- join4_output.csv – Compare Specific Cities of Interest new cases scaled 0 to 10v
- join5_output.csv -Compare Some Countries each new cases scaled 0 – 10v
H. Data format for LOGAN20 and 02NAGOL
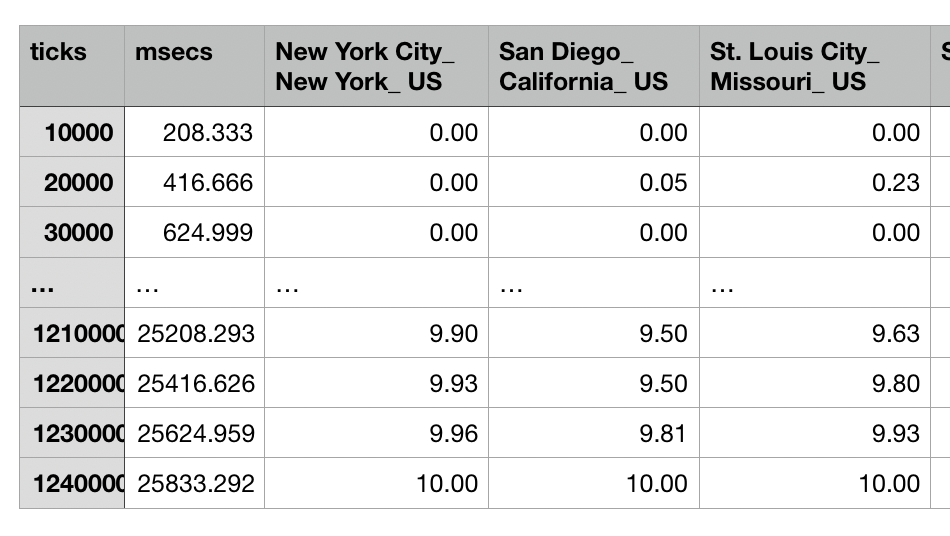
These modules use a CSV file to store 22 columns of data. The “ticks” and “msecs” are determined by the module settings. Since the Covid-19 data doesn’t really relate directly to these parameters, I have chosed 10000 ticks and have formatted my CSV files to match. Here is some example CSV data generated with LOGAN20:
I. CPU and OS Issues
I have tested the Racks on this laptop (more, including Windows coming soon):
- 2015 Macbook Pro i7
J. Scripts and Refreshing the data
Scripts will be shared in future releases (they’re not quite ready for sharing yet).
- getdata.pl – get the covid19 data
- parse_time_series_covid19.pl – parse time_series_covid19_confirmed_global.csv into files by region
- join_time_series_covid19.pl – join files to create banks of 20 regions (useful for 02NAGOL)
- diff_time_series_covid19.pl – compute the “new cases” data
K. Suggested Audification Techniques
- On Filters – coming soon (waiting for participate feedback)
- On Notes – coming soon (waiting for participate feedback)
- On Effects – coming soon (waiting for participate feedback)
- On Scaling – coming soon (waiting for participate feedback)
L. The Future
I see three futures for this project:
- Let’s parse the data in interesting ways and see if we can hear the data
- Perhaps we need to scale or cross reference with population or other data sets
- Let’s share the recordings and perform with the data
In working with this data, I learned a lot about data sets and public awareness. I don’t claim that this data is correct. The curves seem to follow what we see in the news. I’m sharing the data as I received it, in chronological order. We can obtain some interesting audio effects by scrubbing sub ranges or “Georgiafying” (™ TrevoLabs) the data (where we re-sort it to produce different curves).
Enjoy!
M. Downloads
- TrevoScrub-MMAF-C19-Data.zip – download from PatchStorage.com
Video
View more patches in the TrevoCon series…

